
Related Products: LD Module Family (LD1, LD2, LD3, LD4, LD5), DL Module Family (DL1, DL2, DL3, DL4, DL5, DLN), NAI 2250A Phase Angle Voltmeter
Bench-Testing an LVDT or RVDT
How do I measure the performance of an LVDT or RVDT on the bench with a phase angle voltmeter?
An LVDT or RVDT is an AC transformer whose secondary output changes in amplitude with core position and flips phase (0° or 180° relative to the excitation) on either side of null. A phase angle voltmeter (PAV) is the natural instrument for characterizing one because it can resolve the secondary voltage into its in-phase and quadrature components relative to the excitation, read the phase angle directly, form the ratio of the output to the excitation, and measure harmonic distortion — all from the same connections. NAI’s 2250A Digital Phase Angle Voltmeter is one such instrument; the procedure below is written for any PAV with those modes.
For the transducer itself (windings, series-opposed secondaries, why the output is ratiometric), see the LD module manual’s Principle of Operation section. This FAQ covers only the bench method.
What you measure
A full characterization records the following, typically at the transducer’s rated excitation voltage and frequency:
| Parameter | What it tells you |
|---|---|
| Linearity | How far the output deviates from a straight line over the specified stroke |
| Transformation ratio (TR) | Output/excitation voltage ratio at full (maximum) coupling |
| Phase shift | Phase of the secondary output relative to the excitation |
| Null voltage | Residual (mostly quadrature) output at the null position |
| Input impedance | Complex impedance of the primary at the excitation frequency |
| Output impedance | Complex impedance of the secondary |
| Maximum excitation (THD) | The excitation level at which the core begins to saturate |
Test setup
You need three things: the PAV, a positioning fixture, and an AC source that can deliver the transducer’s rated voltage, frequency, and power.
- Positioning fixture. For manual work, a holder for the transducer plus a micrometer whose spindle drives the core (or an indexing head for an RVDT shaft). For automated testing, a PC-driven stepper stage with a linear encoder reporting the true core position.
- Excitation source. An adjustable oscillator (or a programmable one on the instrument bus for an automated set). If the PAV has an internal reference source, that can supply the excitation instead.
- Connections. Drive the primary from the oscillator. Connect the same excitation to the PAV’s Reference input, and the transducer’s secondary output to the PAV’s Signal input.
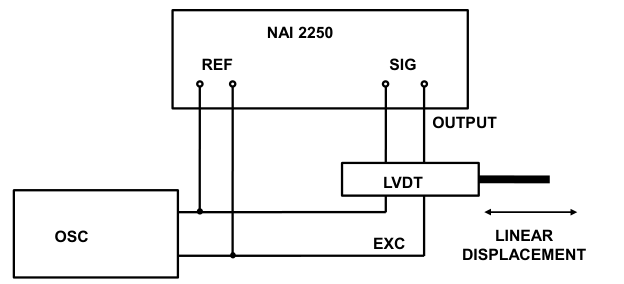
Test-system connections (adapted from NAI application note AN003, “Measuring LVDT/RVDT Performance”).
Linearity and transformation ratio
Set the PAV to display the in-phase ratio — the in-phase component of the signal (fundamental RMS × cos φ) divided by the reference voltage. Using the in-phase component rather than the total RMS rejects the quadrature null voltage and any noise that is not phase-coherent with the excitation.
- Move the core to null (in-phase ratio reads zero).
- Step the core to a set of preselected positions on both sides of null, out to the ends of the rated stroke. Record the in-phase ratio at each position (log it manually or read it over the bus).
- Fit a straight line through the points. The deviation of each point from the line, expressed as a percentage of full-scale output, is the linearity error. For a pass/fail test, compare the worst-case deviation to the transducer’s specification.
- The ratio at maximum coupling (end of stroke) is the transducer’s transformation ratio at the test frequency. This is the value an NAI LD channel’s TR register needs when the channel runs in 2-wire mode (see the terminology note below).
Because the measurement is a ratio to the reference, small drifts in the excitation amplitude cancel and do not show up as linearity error.
Phase shift
With the core at or near full coupling, switch the PAV to read phase between Signal and Reference. A typical LVDT shows a few degrees of lead or lag (the LD manual quotes 5–10° as typical for the differential output relative to the excitation); the manufacturer’s data sheet gives the specified value. A PAV that resolves phase to a small fraction of a degree on low-level signals is useful here because the same measurement near null involves very small voltages.
Null voltage and zero offset
- Put the PAV in in-phase mode and move the core until the reading is zero. This is the electrical null.
- Switch the PAV to quadrature mode without moving the core. Whatever remains is the residual null voltage — the component of the output that is 90° from the excitation and therefore cannot be nulled by moving the core.
- If the in-phase reading at the mechanical zero position is not zero (an offset between the mechanical and electrical null), most PAVs let you enter an offset value, manually or over the bus, so subsequent readings are referred to the mechanical zero.
Separating the two components is the point of the exercise: the in-phase part is real position information, the quadrature part is null voltage that a phase-sensitive converter such as an LD channel will reject.
Ratio measurement: 4-wire versus 5/6-wire transducers
How you form the position ratio depends on which leads the transducer brings out.
- 4-wire transducer (two primary leads, two secondary leads; the secondaries are series-opposed inside the housing). The only output available is VA − VB, so the PAV can only ratio it against the excitation: position ∝ (VA − VB) / VEXC. The result depends on the transducer’s TR and its phase shift, both of which vary from unit to unit and with temperature.
- 5- or 6-wire transducer (both secondaries brought out; a 5-wire unit shares a center tap). Measure VA and VB separately — on a single-channel PAV, by moving the Signal input from one secondary to the other at each core position — and form (VA − VB) / (VA + VB). The excitation amplitude cancels, so the ratio is insensitive to oscillator drift, temperature, and TR. Check that VA + VB stays roughly constant across the stroke; a transducer designed for ratiometric use is built so that it does.
Note the terminology difference: NAI module manuals (and the 2250A’s LVDT measurement screen) count the signal connections, so a 4-wire transducer is read in “2-wire” mode and a 5/6-wire transducer in “3-wire” or “4-wire” mode. See the LD manual’s 2-Wire System and 3-Wire or 4-Wire System sections for the two connection methods and Figure 1 there for the hookups.
Input impedance
Insert a small precision resistor R in series with the primary — 1 Ω or 10 Ω is typical, chosen so that R ≪ Zin. Connect the PAV Reference across the source (E) and the PAV Signal across R, so the Signal input reads the voltage ER = I·R that is proportional to primary current.
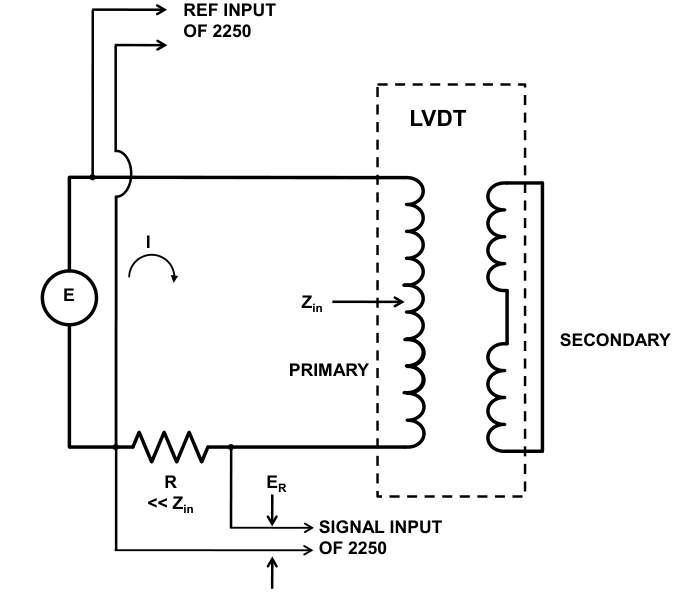
Measuring the primary’s complex input impedance (adapted from AN003).
Since R is small compared with Zin, essentially all of E appears across the primary, and:
| Quantity | PAV mode for ER | Formula |
|---|---|---|
| Magnitude, Zin | Fundamental | Zin ≈ E · R / ER |
| Resistive part, Rin | In-phase (ERI) | Rin = E · R / ERI |
| Reactive part, Xin | Quadrature (ERQ) | Xin = E · R / ERQ |
The Rin and Xin obtained this way describe the primary as a resistance in parallel with a reactance. The PAV’s isolated Reference and Signal inputs are what make this single-instrument measurement possible.
Output impedance
Drive the secondary from the source E through a large series resistor R, with R ≫ Zo, leaving the primary open. Connect the PAV Reference across the source and the PAV Signal across the secondary.
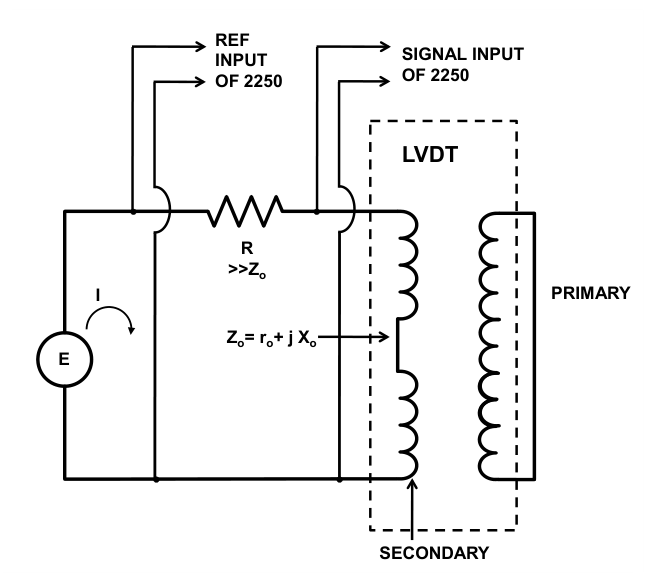
Measuring the secondary’s complex output impedance (adapted from AN003).
Because R dominates, the current is approximately I ≈ E / R, and the voltage the PAV Signal reads across the secondary is I · Zo. Writing Zo = ro + jXo:
| Quantity | PAV mode for the secondary voltage | Formula |
|---|---|---|
| Resistive part, ro | In-phase (EinΦ) | ro = R · EinΦ / E |
| Magnitude, Zo | Fundamental (EFUND) | Zo = R · EFUND / E |
| Reactive part, Xo | Quadrature (EQ) | Xo = R · EQ / E |
Reading displacement directly
If the PAV has a variable-scale (user scale factor) function, you can make the display read distance instead of voltage. Move the core a known distance from null, note the in-phase reading, and enter the ratio of distance to voltage as the scale factor. For example, if a 0.100 in displacement gives 35 mV in-phase, a scale factor of 0.100 / 0.035 = 2.86 makes the readout show 0.100, and every subsequent point reads out in inches. Confirm your instrument offers this mode before planning a test around it.
Maximum excitation (core saturation)
Driving the primary too hard saturates the core and adds harmonics to the output. To find the safe limit, set the PAV to THD mode on the secondary output, start at a low excitation level, and raise the excitation while watching the distortion reading. The level at which THD begins to climb above its low-level value is the maximum excitation for low-distortion operation. Stay below it — both on the bench and when choosing the excitation level an LD channel’s on-board reference (or your system’s excitation source) will supply in the field.
Related
- LD1-LD5 Manual — LVDT/RVDT-to-digital module manual (Principle of Operation, TR and scale registers, 2-/3-/4-wire connection figure)
- LD Module Guide — getting started with the LD family, including a 4-wire channel bring-up sequence
- DL Module Guide — the digital-to-LVDT/RVDT family that generates LVDT/RVDT signals